

You can access Reports by clicking on the Reports tab. This is the section of the program where you will analyze your nutritional profile. You can select a day from the calendar or average your results by selecting a range of days. You can move forward or backward through the calendar and select any date by clicking on it.
You can also select or deselect breakfast, lunch, dinner and snacks to narrow your analysis.
Each of the reports can be exported to a CSV file (comma separated values, readable in Excel), printed or saved from a PDF. The Wizard will assist you in selecting multiple reports to print or export.
Where nutrients are listed, you will be offered a Basic and a Complete view. The Basic view lists common nutrients, and the Complete view provides a more extensive list of nutrients, including all amino acids.
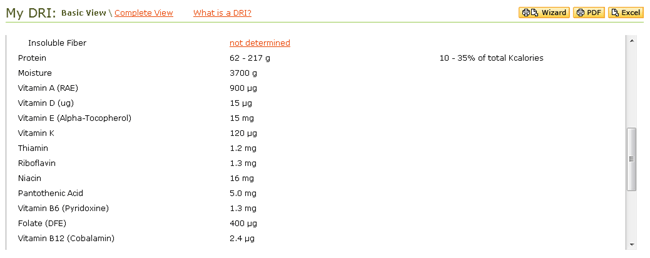
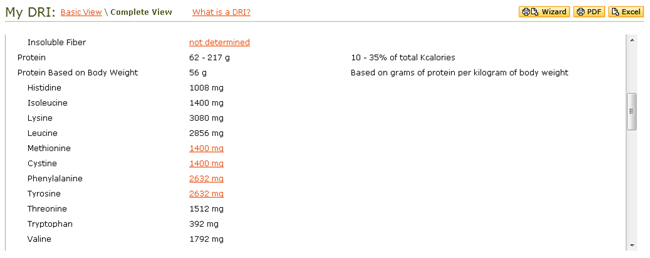
These are your Dietary Reference Intakes, as set by the USDA. DRIs vary according to gender, age, height, weight, activity level, and lifestyle choices such as smoking and vegetarianism.
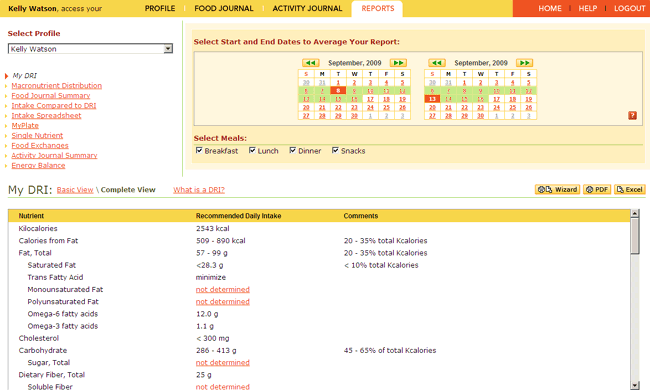
Your recommended daily intake of kilocalories and nutrients is determined according to the age, sex, height, weight, and lifestyle information that you've entered in your profile. This is your benchmark from which to analyze your diet.

The My DRI report is available from a link in the Profile section, or can be referenced in the Intake Compared to DRI report.
The My DRI report can be exported to a CSV file (comma separated values, readable in Excel) or printed.
Use the Food Journal Summary to review your intake for a day or a period of time that you determine. You can view your intakes by the meal or by the day of the week.

The Food Journal Summary report can be exported to a CSV file (comma separated values, readable in Excel) or printed.
Use the Intake Compared to DRI to compare your average nutrient intake to personalized goals. Recommendations are generated based on your own individual characteristics, such as weight and height, and Dietary Reference Intakes. Nutrients that you consume in excess are highlighted along with those that are below recommendations.

This report shows you a list of nutrients, the DRI recommendation, and your intake for the period indicated in the calendars. In addition, a graphic representation of the percent of goal of your intake for each nutrient is shown. There is a Basic and Complete View available for this report. The Basic View contains 36 major nutrients and the Complete View contains 60 nutrients, including all amino acids.
Click on the Macronutrient Distribution button to see the percent of goal for macronutrient ranges.
The Intake Compared to DRI report can be exported to a CSV file (comma separated values, readable in Excel) or printed.
The Macronutrient Distribution is a bar graph that shows your intakes compared to your goals for kilocalories, total fat, carbohydrate, and protein. Your goal is determined by how your profile relates to the Acceptable Macronutrient Distribution Ranges (AMDR).

The Macronutrient Distribution report can be exported to a CSV file (comma separated values, readable in Excel) or printed.
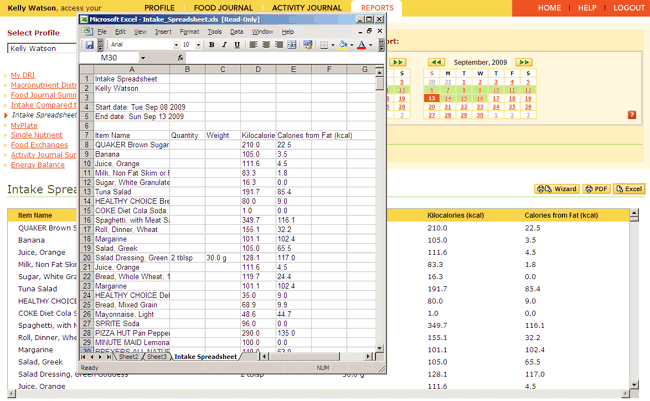
Use the Intake Spreadsheet to scroll through a detailed spreadsheet of the food and drink that you've consumed coupled with the nutrients contained in each item and an average nutrient intake for a range of days that you select.
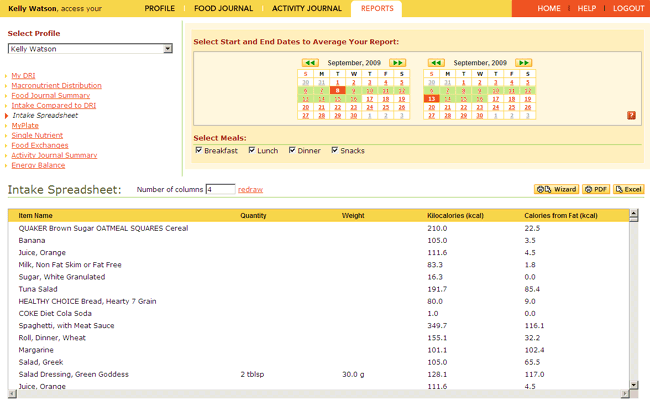
You can change the view of this spreadsheet from 2 to 63 columns by entering the number in the number of columns box and clicking "redraw".
The Intake Spreadsheet report can be exported to a CSV file (comma separated values, readable in Excel) or printed.
Use the MyPlate report to evaluate your diet based upon food groups rather than nutrients. Compare the amounts of grains, fruits, vegetables, meat & beans, milk, and oils you consumed to the recommendations of MyPlate for your energy level. The proportion of your discretionary calorie allowance that has been used is also displayed.

This report gives a graphic analysis of the food groups in MyPlate. Intake is plotted on a bar graph for Grains, Vegetables, Fruits, Milk, Meat & Beans, Oils and Discretionary. There's also a link to the choosemyplate.gov web site.
The MyPlate report can be exported to a CSV file (comma separated values, readable in Excel) or printed.
Use the single nutrient report to focus on a specific nutrient and discover its origins in your diet. The foods are listed in the order that they appear in your Food Journal and the amount of the selected nutrient is shown on the right.
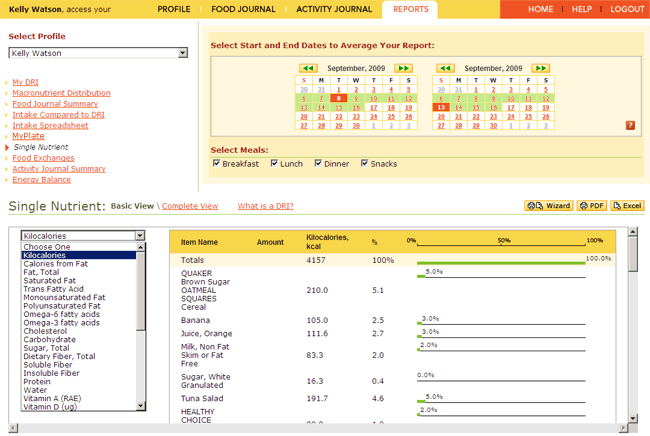
Select an item from the menu on the left, click on it and see both the amount of intake and the percent of goal.
There is a Basic and Complete View available for this report.
The Single Nutrient report can be exported to a CSV file (comma separated values, readable in Excel) or printed.
Use Food Exchanges to review your eating pattern using meal planning exchanges. Learn how your food choices are grouped as carbohydrate (starch, fruit, milk, vegetable, and other), meat & meat substitute (very lean, lean, medium-fat, and high fat), or fat (monounsaturated, polyunsaturated, and saturated). Developed by the American Diabetes Association and the American Dietetic Association, meal planning exchanges help people manage carbohydrate, protein, and fat in their diets.

Exchange values are available for each category.
The Food Exchanges report can be exported to a CSV file (comma separated values, readable in Excel) or printed.
Use the Activity Journal Summary to critique your energy expenditure for a day or as an average over a period of time. Learn how much energy you use for specific activities, such as walking or reading, expressed in total kilocalories or kcal/kg/hour.
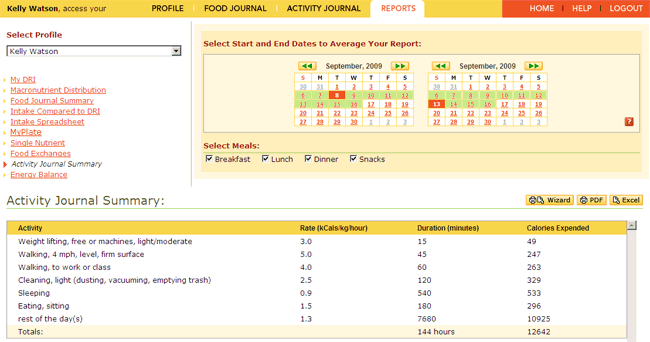
Your activities will be listed with rate, duration and calories expended.
The Activity Journal Summary report can be exported to a CSV file (comma separated values, readable in Excel) or printed.
Use Energy Balance to see kilocalories consumed, kilocalories burned, net kilocalories. A Caloric Summary is shown, indicating Intake vs. Average Intake, Average Expenditure, and Average Net Gain/Loss.
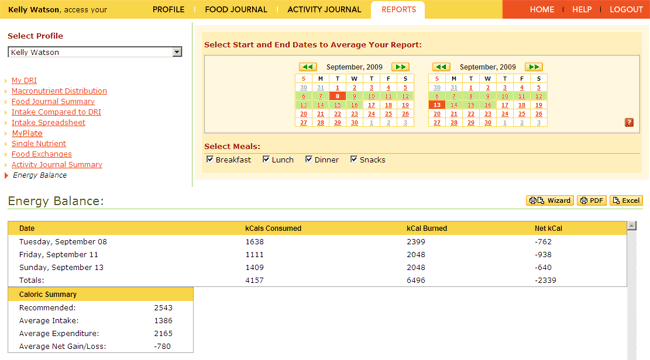
The Energy Balance report can be exported to a CSV file (comma separated values, readable in Excel) or printed.
The Report Wizard allows you to select a number of reports that can be printed as PDFs or Exported as an Excel file. You have a choice to print a Basic or Complete view for relevant reports, and you can select a nutrient for the Single Nutrient Report from a pull down menu.
All reports can be saved as PDF by clicking on the Print button and saving.